Usage
This page includes the most important things to know and understand when using IntelOwl.
How to interact with IntelOwl
Intel Owl main objective is to provide a single API interface to query in order to retrieve threat intelligence at scale.
There are multiple ways to interact with the Intel Owl APIs,
Web Interface
Built-in Web interface with dashboard, visualizations of analysis data, easy to use forms for requesting new analysis, tags management and more features
pyIntelOwl (CLI/SDK)
Official Python client that is available at: PyIntelOwl,
Can be used as a library for your own python projects or…
directly via the command line interface.
goIntelOwl (CLI/SDK)
Official GO client that is available at: go-intelowl
Hint: Tokens Creation
The server authentication is managed by API tokens. So, if you want to interact with Intel Owl, you have two ways to do that:- If you are a normal user, you can go to the "API Access/Sessions" section of the GUI and create a Token there.
- If you are an administrator of IntelOwl, you can create one or more unprivileged users from the Django Admin Interface and then generate a token for those users.
Plugins Framework
Plugins are the core modular components of IntelOwl that can be easily added, changed and customized. There are several types of plugins:
Analyzers
Analyzers are the most important plugins in IntelOwl. They allow to perform data extraction on the observables and/or files that you would like to analyze.
Analyzers list
The following is the list of the available analyzers you can run out-of-the-box. You can also navigate the same list via the
Graphical Interface: once your application is up and running, go to the “Plugins” section
pyintelowl:
$ pyintelowl get-analyzer-config
File analyzers:
Internal tools
APKiD: APKiD identifies many compilers, packers, obfuscators, and other weird stuff from an APK or DEX file.BoxJS_Scan_Javascript: Box-JS is a tool for studying JavaScript malware.Capa_Info: Capa detects capabilities in executable filesCapa_Info_Shellcode: Capa detects capabilities in shellcodeClamAV: scan a file via the ClamAV AntiVirus Engine. IntelOwl automatically keep ClamAV updated with official and unofficial open source signaturesDoc_Info: static document analysis with new features to analyze XLM macros, encrypted macros and more (combination of Oletools and XLMMacroDeobfuscator)ELF_Info: static ELF analysis with pyelftools and telfhashFile_Info: static generic File analysis (hashes, magic and exiftool)Floss: Mandiant Floss Obfuscated String Solver in filesPE_Info: static PE analysis with pefilePEframe_Scan: Perform static analysis on Portable Executable malware and malicious MS Office documents with PeFrameQiling_Linux: Qiling qiling linux binary emulation.Qiling_Linux_Shellcode: Qiling qiling linux shellcode emulation.Qiling_Windows: Qiling qiling windows binary emulation.Qiling_Windows_Shellcode: Qiling qiling windows shellcode emulation.Quark_Engine: Quark Engine is an Obfuscation-Neglect Android Malware Scoring System.Rtf_Info: static RTF analysis (Oletools)Signature_Info: PE signature extractor with osslsigncodeSpeakeasy: Mandiant Speakeasy binary emulationSpeakEasy_Shellcode: Mandiant Speakeasy shellcode emulationStrings_Info: Strings extraction. Leverages Mandiant’s StringsifterSuricata: Analyze PCAPs with open IDS signatures with Suricata engineThug_HTML_Info: Perform hybrid dynamic/static analysis on a HTML file using Thug low-interaction honeyclientXlm_Macro_Deobfuscator: XlmMacroDeobfuscator deobfuscate xlm macrosYara: scan a file withyour own added signatures. See Advanced-Usage for more details.
External services
CapeSandbox: CAPESandbox automatically scans suspicious files using the CapeSandbox API. Analyzer works for private instances as well.Cymru_Hash_Registry_Get_File: Check if a particular file is known to be malware by Team CymruCuckoo_Scan: scan a file on Cuckoo (this analyzer is disabled by default. You have to change that flag in the config to use it)DocGuard_Upload_File: Analyze office files in seconds. DocGuard.Dragonfly_Emulation: Emulate malware against Dragonfly sandbox by Certego S.R.L.FileScan_Upload_File: Upload your file to extract IoCs from executable files, documents and scripts via FileScan.io API.HashLookupServer_Get_File: check if a md5 or sha1 is available in the database of known file hosted by CIRCLHybridAnalysis_Get_File: check file hash on HybridAnalysis sandbox reportsIntezer_Scan: scan a file on Intezer. Register for a free community account here. With TLPCLEAR, in case the hash is not found, you would send the file to the service.Malpedia_Scan: scan a binary or a zip file (pwd:infected) against all the yara rules available in MalpediaMalwareBazaar_Get_File: Check if a particular malware sample is known to MalwareBazaarMISPFIRST_Check_Hash: check a file hash on the FIRST MISP instanceMISP_Check_Hash: check a file hash on a MISP instanceMWDB_Scan: mwdblib Retrieve malware file analysis from repository maintained by CERT Polska MWDB. With TLPCLEAR, in case the hash is not found, you would send the file to the service.OTX_Check_Hash: check file hash on Alienvault OTXSublimeSecurity: Analyze an Email with Sublime Security live flowTriage_Scan: leverage Triage sandbox environment to scan various filesUnpacMe: UnpacMe is an automated malware unpacking serviceVirushee_Scan: Check file hash on Virushee API. With TLPCLEAR, in case the hash is not found, you would send the file to the service.VirusTotal_v3_File: check the file hash on VirusTotal. With TLPCLEAR, in case the hash is not found, you would send the file to the service.YARAify_File_Scan: scan a file against public and non-public YARA and ClamAV signatures in YARAify public serviceYARAify_File_Search: scan an hash against YARAify databaseZippy_scan: Zippy: Fast method to classify text as AI or human-generated; takes inlzma,zlib,brotlias input based engines;ensemblebeing default.
Observable analyzers (ip, domain, url, hash)
Internal tools
CheckDMARC: An SPF and DMARC DNS records validator for domains.DNStwist: Scan a url/domain to find potentially malicious permutations via dns fuzzing. dnstwist repoThug_URL_Info: Perform hybrid dynamic/static analysis on a URL using Thug low-interaction honeyclient
External services
AbuseIPDB: check if an ip was reported on AbuseIPDBBGP Ranking: BGP-Ranking provides a way to collect such malicious activities, aggregate the information per ASN and provide a ranking model to rank the ASN from the most malicious to the less malicious ASN.Anomali_Threatstream_PassiveDNS: Return information from passive dns of Anomali. On Anomali Threatstream PassiveDNS Api.Auth0: scan an IP against the Auth0 APIBinaryEdge: Details about an Host. List of recent events for the specified host, including details of exposed ports and services using IP query and return list of subdomains known from the target domains using domain queryBitcoinAbuse: Check a BTC address against bitcoinabuse.com, a public database of BTC addresses used by hackers and criminals.Censys_Search: scan an IP address against Censys View APICheckPhish: CheckPhish can detect phishing and fraudulent sites.CIRCLPassiveDNS: scan an observable against the CIRCL Passive DNS DBCIRCLPassiveSSL: scan an observable against the CIRCL Passive SSL DBClassic_DNS: Retrieve current domain resolution with default DNSCloudFlare_DNS: Retrieve current domain resolution with CloudFlare DoH (DNS over HTTPS)CloudFlare_Malicious_Detector: Leverages CloudFlare DoH to check if a domain is related to malwareCrowdsec: check if an IP was reported on Crowdsec Smoke DatasetCymru_Hash_Registry_Get_Observable: Check if a particular hash is available in the malware hash registry of Team CymruDNSDB: scan an observable against the Passive DNS Farsight Database (support both v1 and v2 versions)DNS0_EU: Retrieve current domain resolution with DNS0.eu DoH (DNS over HTTPS)DNS0_EU_Malicious_Detector: Check if a domain or an url is marked as malicious in DNS0.eu database (Zero service)DNS0_names: Run advanced searches on billions of current and historical domain names. (DNS0 /names)DNS0_rrsets_data: Query billions of current and historical DNS resource records sets. Performs right-hand side matching. (DNS0 /rrsets)DNS0_rrsets_name: Query billions of current and historical DNS resource records sets. Performs left-hand side matching. (DNS0 /rrsets)DocGuard_Get: check if an hash was analyzed on DocGuard. DocGuardFeodo_Tracker: Feodo Tracker offers various blocklists, helping network owners to protect their users from Dridex and Emotet/Heodo.FileScan_Search: Finds reports and uploaded files by various tokens, like hash, filename, verdict, IOCs etc via FileScan.io API.FireHol_IPList: check if an IP is in FireHol’s IPListGoogleSafebrowsing: Scan an observable against GoogleSafeBrowsing DBGoogleWebRisk: Scan an observable against WebRisk API (Commercial version of Google Safe Browsing). Check the docs to enable this properlyGoogle_DNS: Retrieve current domain resolution with Google DoH (DNS over HTTPS)GreedyBear: scan an IP or a domain against the GreedyBear API (requires API key)GreyNoise: scan an IP against the Greynoise API (requires API key)GreyNoiseCommunity: scan an IP against the Community Greynoise API (requires API key))HashLookupServer_Get_Observable: check if a md5 or sha1 is available in the database of known file hosted by CIRCLHoneyDB_Get: HoneyDB IP lookup serviceHoneyDB_Scan_Twitter: scan an IP against HoneyDB.io’s Twitter Threat FeedHunter_How: Scans IP and domain against Hunter_How API.Hunter_Io: Scans a domain name and returns set of data about the organisation, the email address found and additional information about the people owning those email addresses.HybridAnalysis_Get_Observable: search an observable in the HybridAnalysis sandbox reportsIPQS_Fraud_And_Risk_Scoring: Scan an Observable against IPQualityscoreInQuest_DFI: Deep File Inspection by InQuest LabsInQuest_IOCdb: Indicators of Compromise Database by InQuest LabsInQuest_REPdb: Search in InQuest Lab’s Reputation DatabaseIPApi: Get information about IPs using batch-endpoint and DNS using DNS-endpoint.IPInfo: Location Information about an IPIp2location: API Docs IP2Location.io allows users to check IP address location in real time. (Supports both with or without key)Intezer_Get: check if an analysis related to a hash is available in Intezer. Register for a free community account here.Koodous: koodous API get information about android malware.MalwareBazaar_Get_Observable: Check if a particular malware hash is known to MalwareBazaarMalwareBazaar_Google_Observable: Check if a particular IP, domain or url is known to MalwareBazaar using google searchMaxMindGeoIP: extract GeoIP info for an observableMISP: scan an observable on a MISP instanceMISPFIRST: scan an observable on the FIRST MISP instanceMmdb_server: Mmdb_server mmdb-server is an open source fast API server to lookup IP addresses for their geographic location, AS number.Mnemonic_PassiveDNS: Look up a domain or IP using the Mnemonic PassiveDNS public API.MWDB_Get: mwdblib Retrieve malware file analysis by hash from repository maintained by CERT Polska MWDB.Netlas: search an IP against NetlasONYPHE: search an observable in ONYPHEOpenCTI: scan an observable on an OpenCTI instanceOTXQuery: scan an observable on Alienvault OTXPhishstats: Search PhishStats API to determine if an IP/URL/domain is malicious.Phishtank: Search an url against Phishtank APIPhishingArmy: Search an observable in the PhishingArmy blocklistPulsedive: Scan indicators and retrieve results from Pulsedive’s API.Quad9_DNS: Retrieve current domain resolution with Quad9 DoH (DNS over HTTPS)Quad9_Malicious_Detector: Leverages Quad9 DoH to check if a domain is related to malwareRobtex: scan a domain/IP against the Robtex Passive DNS DBSecuritytrails: scan an IP/Domain against Securitytrails APIShodan_Honeyscore: scan an IP against Shodan Honeyscore APIShodan_Search: scan an IP against Shodan Search APISpyse: Scan domains, IPs, emails and CVEs using Spyse’s API. Register here.SSAPINet: get a screenshot of a web page using screenshotapi.net (external source); additional config options can be added toextra_api_paramsin the config.Stalkphish: Search Stalkphish API to retrieve information about a potential phishing site (IP/URL/domain/Generic).Stratosphere_Blacklist: Cross-reference an IP from blacklists maintained by Stratosphere LabsTalosReputation: check an IP reputation from TalosThreatFox: search for an IOC in ThreatFox’s databaseThreatminer: retrieve data from Threatminer APITorNodesDanMeUk: check if an IP is a Tor Node using a list of all Tor nodes provided by dan.me.ukTorProject: check if an IP is a Tor Exit NodeTriage_Search: Search for reports of observables or upload from URL on triage cloudTranco: Check if a domain is in the latest Tranco ranking top sites listURLhaus: Query a domain or URL against URLhaus API.UrlScan_Search: Search an IP/domain/url/hash against URLScan APIUrlScan_Submit_Result: Submit & retrieve result of an URL against URLScan APIVirushee_CheckHash: Search for a previous analysis of a file by its hash (SHA256/SHA1/MD5) on Virushee API.VirusTotal_v3_Get_Observable: search an observable in the VirusTotal DBWhoisxmlapi: Fetch WHOIS record data, of a domain name, an IP address, or an email address.WhoIs_RipeDB_Search: Fetch whois record data of an IP address from Ripe DB using their search API (no API key required)XForceExchange: scan an observable on IBM X-Force ExchangeYARAify_Search: lookup a file hash in Abuse.ch YARAifyYETI(Your Everyday Threat Intelligence): scan an observable on a YETI instance.Zoomeye: Zoomeye Cyberspace Search Engine recording information of devices, websites, services and components etc..Validin:Validin investigates historic and current data describing the structure and composition of the internet.TweetFeed: TweetFeed collects Indicators of Compromise (IOCs) shared by the infosec community at Twitter.\r\nHere you will find malicious URLs, domains, IPs, and SHA256/MD5 hashes.
Generic analyzers (email, phone number, etc.; anything really)
Some analyzers require details other than just IP, URL, Domain, etc. We classified them as generic Analyzers. Since the type of field is not known, there is a format for strings to be followed.
Internal tools
CyberChef: Run a query on a CyberChef server using pre-defined or custom recipes.
External services
Anomali_Threatstream_Confidence: Give max, average and minimum confidence of maliciousness for an observable. On Anomali Threatstream Confidence API.Anomali_Threatstream_Intelligence: Search for threat intelligence information about an observable. On Anomali Threatstream Intelligence API.CRXcavator: scans a chrome extension against crxcavator.ioDehashed_Search: Query any observable/keyword against https://dehashed.com’s search API.EmailRep: search an email address on emailrep.ioHaveIBeenPwned: HaveIBeenPwned checks if an email address has been involved in a data breachIntelX_Intelligent_Search: IntelligenceX is a search engine and data archive. Fetches emails, urls, domains associated with an observable or a generic string.IntelX_Phonebook: IntelligenceX is a search engine and data archive. Fetches emails, urls, domains associated with an observable or a generic string.IPQS_Fraud_And_Risk_Scoring: Scan an Observable against IPQualityscoreMISP: scan an observable on a MISP instanceVirusTotal_v3_Intelligence_Search: Perform advanced queries with VirusTotal Intelligence (requires paid plan)WiGLE: Maps and database of 802.11 wireless networks, with statistics, submitted by wardrivers, netstumblers, and net huggers.YARAify_Generics: lookup a YARA rule (default), ClamAV rule, imphash, TLSH, telfhash or icon_dash in YARAifyPhoneInfoga: PhoneInfoga is one of the most advanced tools to scan international phone numbers.
Optional analyzers
Some analyzers are optional and need to be enabled explicitly.
Connectors
Connectors are designed to run after every successful analysis which makes them suitable for automated threat-sharing. They support integration with other SIEM/SOAR projects, specifically aimed at Threat Sharing Platforms.
Connectors list
The following is the list of the available connectors. You can also navigate the same list via the
Graphical Interface: once your application is up and running, go to the “Plugins” section
pyintelowl:
$ pyintelowl get-connector-config
List of pre-built Connectors
MISP: automatically creates an event on your MISP instance, linking the successful analysis on IntelOwl.OpenCTI: automatically creates an observable and a linked report on your OpenCTI instance, linking the the successful analysis on IntelOwl.YETI: YETI = Your Everyday Threat Intelligence. find or create observable on YETI, linking the successful analysis on IntelOwl.Slack: Send the analysis link to a Slack channel (useful for external notifications)
Pivots
With IntelOwl v5.2.0 we introduced the Pivot Plugin.
Pivots are designed to create a job from another job. This plugin allows the user to set certain conditions that trigger the execution of one or more subsequent jobs, strictly connected to the first one.
This is a “SOAR” feature that allows the users to connect multiple analysis together.
Right now the support for this kind of plugin in the GUI is very limited, while the backend is fully operative. We are working on the frontend.
List of pre-built Pivots
None
Visualizers
With IntelOwl v5 we introduced a new plugin type called Visualizers. You can leverage it as a framework to create custom aggregated and simplified visualization of analyzer results.
Visualizers are designed to run after the analyzers and the connectors. The visualizer adds logic after the computations, allowing to show the final result in a different way than merely the list of reports.
Visualizers can be executed only during Scans through the playbook that has been configured on the visualizer itself.
This framework is extremely powerful and allows every user to customize the GUI as they wish. But you know…with great power comes great responsability. To fully leverage this framework, you would need to put some effort in place. You would need to understand which data is useful for you and then write few code lines that would create your own GUI. To simplify the process, take example from the pre-built visualizers listed below and follow the dedicated documentation.
List of pre-built Visualizers
DNS: displays the aggregation of every DNS analyzer reportYara: displays the aggregation of every matched rule by theYaraAnalyzerDomain_Reputation: Visualizer for the Playbook “Popular_URL_Reputation_Services”IP_Reputation: Visualizer for the Playbook “Popular_IP_Reputation_Services”Pivot: Visualizer that can be used in a Playbook to show the Pivot execution result. See Pivots for more info.
Ingestors
With IntelOwl v5.1.0 we introduced the Ingestor Plugin.
Ingestors allow to automatically insert IOC streams from outside sources to IntelOwl itself.
Each Ingestor must have a Playbook attached: this will allow to create a Job from every IOC retrieved.
Ingestors are system-wide and disabled by default, meaning that only the administrator are able to configure them and enable them. Ingestors can be spammy so be careful about enabling them.
A very powerful use is case is to combine Ingestors with Connectors to automatically extract data from external sources, analyze them with IntelOwl and push them externally to another platform (like MISP or a SIEM)
List of pre-built Ingestors
ThreatFox: Retrieves daily ioc fromhttps://threatfox.abuse.ch/and analyze them.
Playbooks
Playbooks are designed to be easy to share sequence of running Plugins (Analyzers, Connectors, …) on a particular kind of observable.
If you want to avoid to re-select/re-configure a particular combination of analyzers and connectors together every time, you should create a playbook out of it and use it instead. This is time saver.
This is a feature introduced since IntelOwl v4.1.0! Please provide feedback about it!
Playbooks List
The following is the list of the available pre-built playbooks. You can also navigate the same list via the
Graphical Interface: once your application is up and running, go to the “Plugins” section
pyintelowl:
$ pyintelowl get-playbook-config
List of pre-built playbooks
FREE_TO_USE_ANALYZERS: A playbook containing all free to use analyzers.Sample_Static_Analysis: A playbook containing all analyzers that perform static analysis on files.Popular_URL_Reputation_Services: Collection of the most popular and free reputation analyzers for URLs and DomainsPopular_IP_Reputation_Services: Collection of the most popular and free reputation analyzers for IP addressesDns: A playbook containing all dns providers
Playbooks creation and customization
You can create new playbooks in different ways, based on the users you want to share them with:
If you want to share them to every user in IntelOwl, create them via the Django Admin interface at /admin/playbooks_manager/playbookconfig/.
If you want share them to yourself or your organization only, you need to leverage the “Save as Playbook” button that you can find on the top right of the Job Result Page. In this way, after you have done an analysis, you can save the configuration of the Plugins you executed for re-use with a single click.

The created Playbook would be available to yourself only. If you want either to share it with your organization or to delete it, you need to go to the “Plugins” section and enable it manually by clicking the dedicated button.

Generic Plugin Creation, Configuration and Customization
If you want to create completely new Plugins (not based on already existing python modules), please refer to the Contribute section. This is usually the case when you want to integrate IntelOwl with either a new tool or a new service.
On the contrary, if you would like to just customize the already existing plugins, this is the place.
SuperUser customization
If you are an IntelOwl superuser, you can create, modify, delete analyzers based on already existing modules by changing the configuration values inside the Django Admin interface at:
for analyzers:
/admin/analyzers_manager/analyzerconfig/.for connectors:
/admin/connectors_manager/connectorconfig/.…and so on for all the Plugin types.
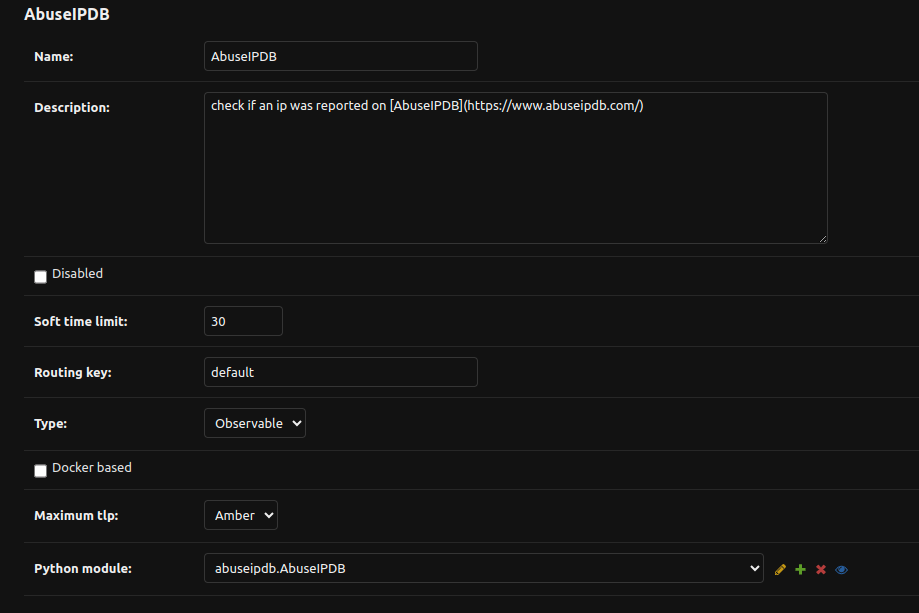
The following are the most important fields that you can change without touching the source code:
Name: Name of the analyzerDescription: Description of the analyzerDisabled: you can choose to disable certain analyzers, then they won’t appear in the dropdown list and won’t run if requested.Python Module: Python path of the class that will be executed. This should not be changed most of the times.Maximum TLP: see TLP SupportSoft Time Limit: this is the maximum time (in seconds) of execution for an analyzer. Once reached, the task will be killed (or managed in the code by a custom Exception). Default300.Routing Key: this takes effects only when multi-queue is enabled. Choose which celery worker would execute the task:local(ideal for tasks that leverage local applications like Yara),long(ideal for long tasks) ordefault(ideal for simple webAPI-based analyzers).
For analyzers only:
Supported Filetypes: can be populated as a list. If set, if you ask to analyze a file with a different mimetype from the ones you specified, it won’t be executedNot Supported Filetypes: can be populated as a list. If set, if you ask to analyze a file with a mimetype from the ones you specified, it won’t be executedObservable Supported: can be populated as a list. If set, if you ask to analyze an observable that is not in this list, it won’t be executed. Valid values are:ip,domain,url,hash,generic.
For connectors only:
Run on Failure(default:true): if they can be run even if the job has statusreported_with_fails
For visualizers only:
Playbooks: list of playbooks that trigger the specified visualizer execution.
Sometimes, it may happen that you would like to create a new analyzer very similar to an already existing one. Maybe you would like to just change the description and the default parameters.
A helpful way to do that without having to copy/pasting the entire configuration, is to click on the analyzer that you want to copy, make the desired changes, and click the save as new button.
Warning
Changing other keys can break a plugin. In that case, you should think about duplicating the configuration entry or python module with your changes.Other options can be added at the “Python module” level and not at the Plugin level. To do that, go to: admin/api_app/pythonmodule/ and select the Python module used by the Plugin that you want to change.
For example, the analyzer AbuseIPDB uses the Python module abuseipdb.AbuseIPDB.
Once there, you’ll get this screen:
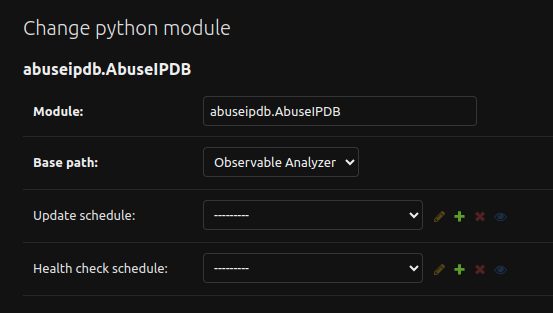
There you can change the following values:
Update Schedule: if the analyzer require some sort of update (local database, local rules, …), you can specify the crontab schedule to update them.Health Check Schedule: if the analyzer has implemented a Health Check, you can specify the crontab schedule to check whether the service works or not.
Parameters
Each Plugin could have one or more parameters available to be configured. These parameters allow the users to customize the Plugin behavior.
There are 2 types of Parameters:
classic Parameters
Secrets: these parameters usually manage sensitive data, like API keys.
To see the list of these parameters:
You can view the “Plugin” Section in IntelOwl to have a complete and updated view of all the options available
You can view the parameters by exploring the Django Admin Interface:
admin/api_app/parameter/or at the very end of each Plugin configuration like
/admin/analyzers_manager/analyzerconfig/
You can change the Plugin Parameters at 5 different levels:
if you are an IntelOwl superuser, you can go in the Django Admin Interface and change the default values of the parameters for every plugin you like. This option would change the default behavior for every user in the platform.
if you are either Owner or Admin of an org, you can customize the default values of the parameters for every member of the organization by leveraging the GUI in the “Organization Config” section. This overrides the previous option.
if you are a normal user, you can customize the default values of the parameters for your analysis only by leveraging the GUI in the “Plugin config” section. This overrides the previous option.
You can choose to provide runtime configuration when requesting an analysis that will override the previous options. This override is done only for the specific analysis. See Customize analyzer execution at time of request
Playbook Exception
Please remember that, if you are executing a Playbook, the "Runtime configuration" of the Playbook take precedence over the Plugin Configuration.Plugin Configuration Order
Due to the multiple chances that are given to customize the parameters of the Plugins that are executed, it may be easy to confuse the order and launch Plugins without the awereness of what you are doing.This is the order to define which values are used for the parameters, starting by the most important element:
Runtime Configuration at Time of Request.
Runtime Configuration of the Playbook (if a Playbook is used and the Runtime Configuration at Time of Request is empty)
Plugin Configuration of the User
Plugin Configuration of the Organization
Default Plugin Configuration of the Parameter
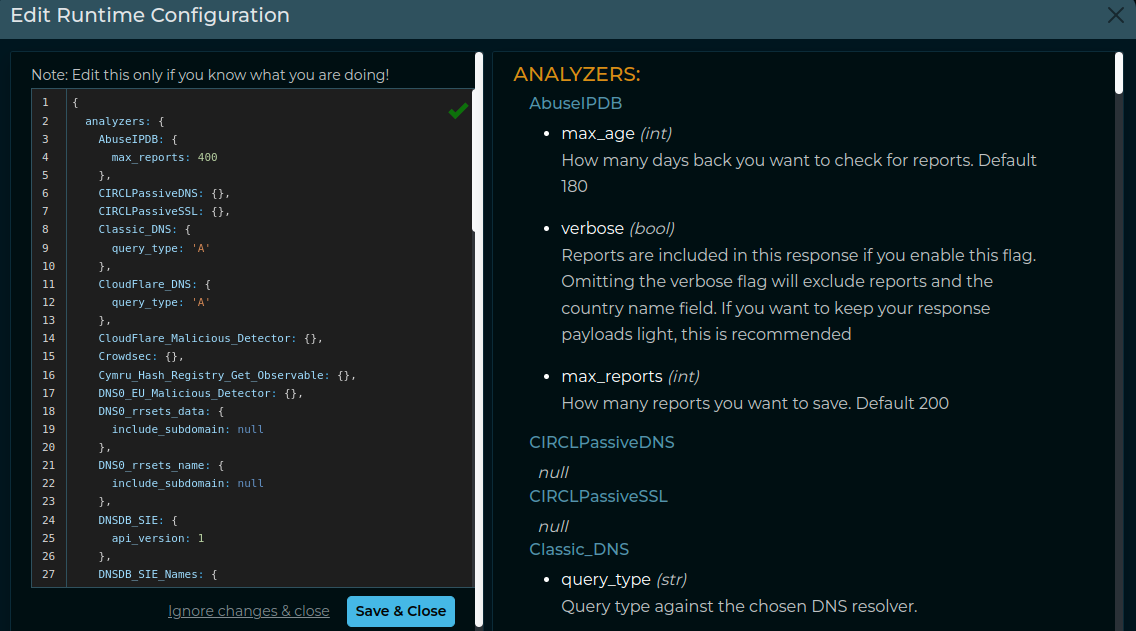
If you are using the GUI, please remember that you can always check the Parameters before starting a “Scan” by clicking at the “Runtime configuration”  button.
Example:
Enabling or Disabling Plugins
By default, each available plugin is configured as either disabled or not. The majority of them are enabled by default, while others may be disabled to avoid potential problems in the application usability for first time users.
Considering the impact that this change could have in the application, the GUI does not allow a normal user to enable/disable any plugin. On the contrary, users with specific privileges may change this configuration:
Org Administrators may leverage the feature documented here to enable/disable plugins for their org. This can be helpful to control users’ behavior.
IntelOwl Superusers (full admin) can go to the Django Admin Interface and enable/disable them from there. This operation does overwrite the Org administrators configuration. To find the plugin to change, they’ll need to first choose the section of its type (”ANALYZERS_MANAGER”, “CONNECTORS_MANAGER”, etc), then select the chosen plugin, change the flag on that option and save the plugin by pressing the right button.


Special Plugins operations
All plugins, i.e. analyzers and connectors, have kill and retry actions. In addition to that, all docker-based analyzers and connectors have a healthcheck action to check if their associated instances are up or not.
kill:
Stop a plugin whose status is
running/pending:GUI: Buttons on reports table on job result page.
PyIntelOwl:
IntelOwl.kill_analyzerandIntelOwl.kill_connectorfunction.CLI:
$ pyintelowl jobs kill-analyzer <job_id> <analyzer_name>and$ pyintelowl jobs kill-connector <job_id> <connector_name>API:
PATCH /api/job/{job_id}/{plugin_type/{plugin_name}/killandPATCH /api/job/{job_id}/connector/{connector_name}/kill
retry:
Retry a plugin whose status is
failed/killed:GUI: Buttons on reports table on job result page.
PyIntelOwl:
IntelOwl.retry_analyzerandIntelOwl.retry_connectorfunction,CLI:
$ pyintelowl jobs retry-analyzer <job_id> <analyzer_name>and$ pyintelowl jobs retry-connector <job_id> <connector_name>API:
PATCH /api/job/{job_id}/{plugin_type}/{plugin_name}/retry
healthcheck:
Check if a plugin is able to connect to its provider:
GUI: Buttons on every plugin table.
PyIntelOwl:
IntelOwl.analyzer_healthcheckandIntelOwl.connector_healthcheckmethods.CLI:
$ pyintelowl analyzer-healthcheck <analyzer_name>and$ pyintelowl connector-healthcheck <connector_name>API:
GET /api/{plugin_type}/{plugin_name}/healthcheck
pull:
Update a plugin with the newest rules/database:
GUI: Buttons on every plugin table.
API:
POST /api/{plugin_type}/{plugin_name}/pull
TLP Support
The Traffic Light Protocol (TLP) is a standard that was created to facilitate greater sharing of potentially sensitive information and more effective collaboration.
IntelOwl is not a threat intel sharing platform, like the MISP platform. However, IntelOwl is able to share analysis results to external platforms (via Connectors) and to send possible privacy related information to external services (via Analyzers).
This is why IntelOwl does support a customized version of the Traffic Light Protocol (TLP): to allow the user to have a better knowledge of how their data are being shared.
Every Analyzer and Connector can be configured with a maximum_tlp value.
Based on that value, IntelOwl understands if the specific plugin is allowed or not to run (e.g. if maximum_tlp is GREEN, it would run for analysis with TLPs WHITE and GREEN only)
These is how every available TLP value behaves once selected for an analysis execution:
CLEAR: no restriction (WHITEwas replaced byCLEARin TLP v2.0, butWHITEis supported for retrocompatibility)GREEN: disable analyzers that could impact privacyAMBER(default): disable analyzers that could impact privacy and limit view permissions to my groupRED: disable analyzers that could impact privacy, limit view permissions to my group and do not use any external service
Investigations Framework
Investigations are a new framework introduced in IntelOwl v6 with the goal to allow the users to connect the analysis they do with each other.
In this way the analysts can use IntelOwl as the starting point of their “Investigations”, register their findings, correlate the information found, and collaborate…all in a single place.
Things to know about the framework:
an Investigation is a superset of IntelOwl Jobs. It can have attached one or more existing IntelOwl Jobs
an Investigation contains a “description” section that can be changed and updated at anytime with new information from the analysts.
modification to the Investigation (description, jobs, etc) can be done by every member of the Organization where the creator of the Investigation belongs. However only they creator can delete an Investigation.
Create and populate an investigation
Investigations are created in 2 ways:
automatically:
if you scan multiple observables at the same time, a new investigation will be created by default and all the observables they will be automatically connected to the same investigation.
if you run a Job with a Playbook which contains a Pivot that triggers another Job, a new investigation will be created and both the Jobs will be added to the same investigation.
manually: by clicking on the button in the “History” section you can create an Investigation from scratch without any job attached (see following image)

If you want to add a job to an Investigation, you should click to the root block of the Investigation (see following image):

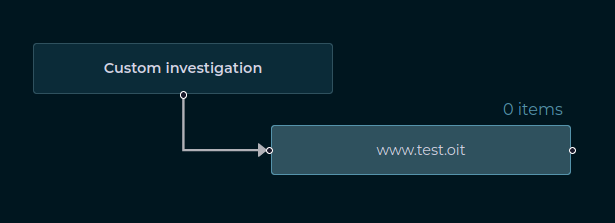
Once a job has been added, you’ll have something like this:
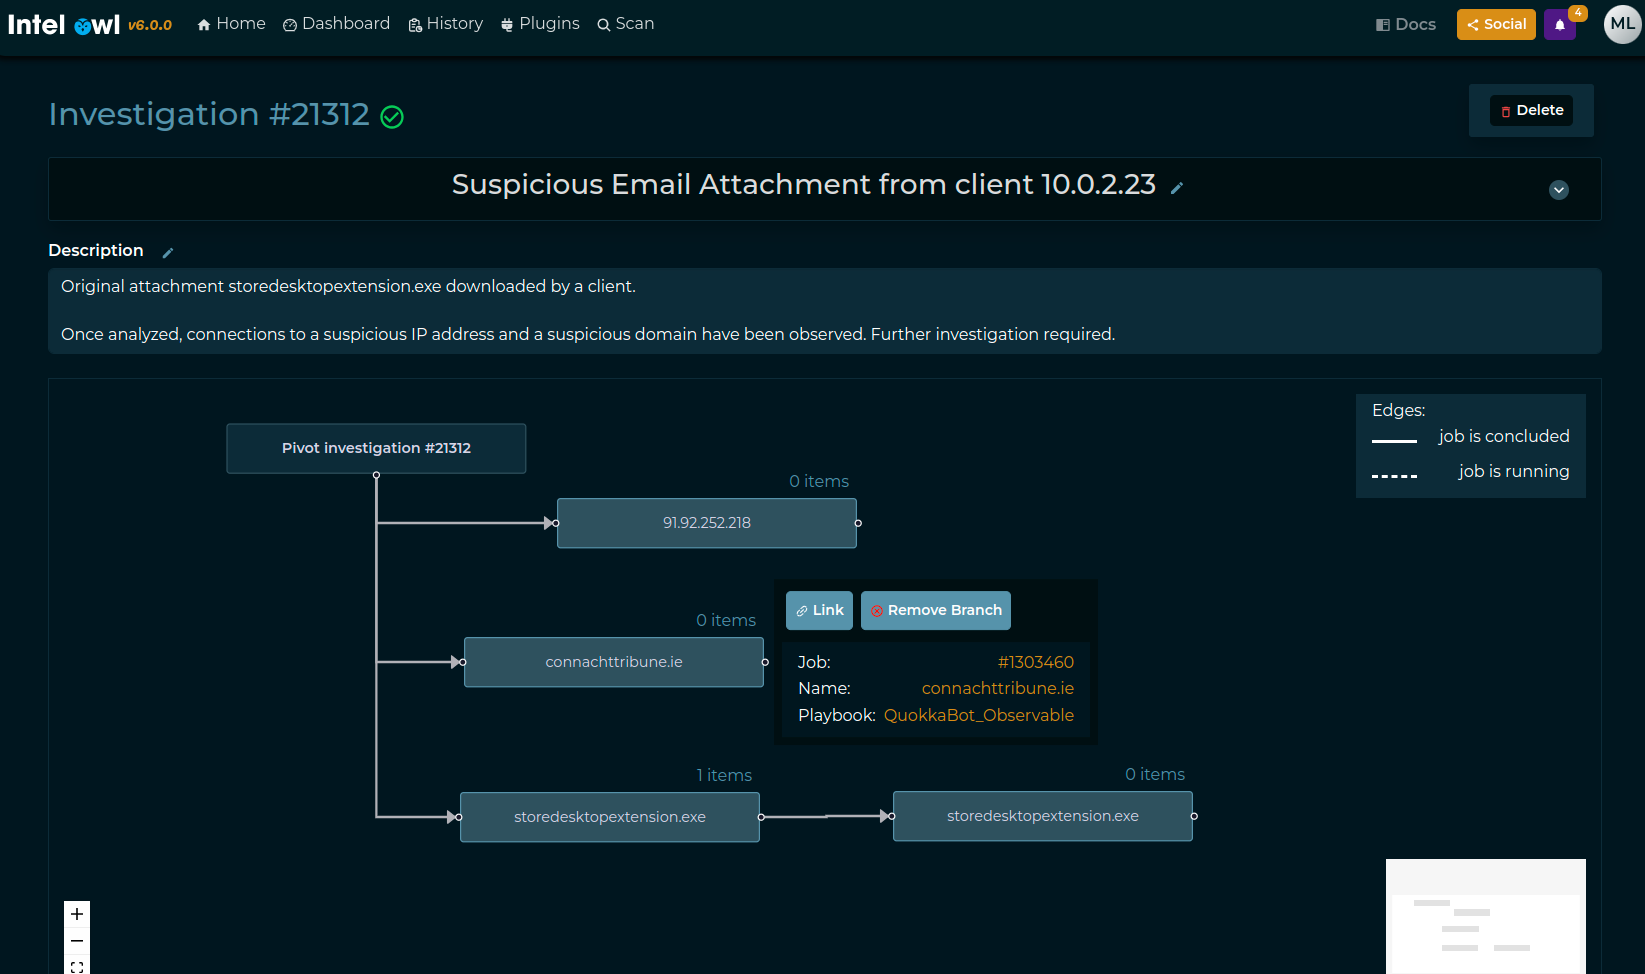
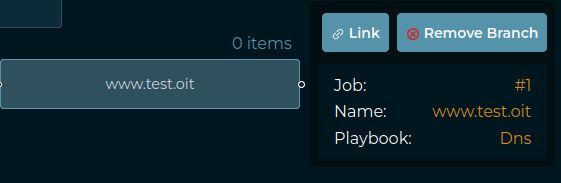
If you want to remove a Job, you can click on the Job block and click “Remove branch”. On the contrary, if you just want to see Job Results, you can click in the “Link” button. (check next image)
Example output of a complex investigation